import statsmodels.formula.api as smf

# Treatment exposure begins in 2010 for the treated group.
data["post"] = (data["year"] >= 2010).astype(int)
data["treatment"] = data["treated"] * data["post"]

# C() treats unit and year as categories, giving their fixed effects.
twfe = smf.ols(
    "outcome ~ treatment + C(unit) + C(year)", data=data
).fit(cov_type="cluster", cov_kwds={"groups": data["unit"]})
print(twfe.summary())Week 9: Two-Way Fixed Effects and Event Studies
Fertility · PP5001 · Martinmas 2026
Class slides · Slides PDF · Notes PDF
Learning Objectives
By the end of this topic, you should be able to:
- Explain how unit and time fixed effects extend the two-period DiD regression.
- State what variation identifies the treatment coefficient and what parallel trends requires.
- Construct event-time indicators and interpret coefficients relative to an omitted period.
- Read an event-study graph, including its uncertainty, and assess evidence about pre-trends, anticipation and treatment dynamics.
- Evaluate how choices about the comparison group, time window and controls affect a causal argument.
Before class
Read these notes alongside Cesur, Güneş, Tekin and Ulker (2023), Kearney and Levine (2015) and Jaeger, Joyce and Kaestner (2020), available in Moodle. We begin with healthcare and fertility in Turkey, then use the debate over 16 and Pregnant to examine the credibility of an event-study design.
Textbook references
- The Effect: Chapter 16, Fixed Effects, Chapter 17, Event Studies, and Chapter 18, Difference-in-Differences.
- Causal Inference: The Remix: the chapters on panel data and difference-in-differences.
- Mastering ’Metrics: Chapter 5, Differences-in-Differences. Companion resources and Mastering Econometrics videos at MRU.
- Mostly Harmless Econometrics — advanced reading: Chapter 5, Parallel Worlds: Fixed Effects, Differences-in-Differences, and Panel Data.
Additional reading: Douglas Miller (2023), An Introductory Guide to Event Study Models.
Recall: The Two-Period DiD
Let T_i indicate membership in the treatment group and Post_t indicate the post-treatment period.
Y_{it}=\alpha+\gamma T_i+\tau Post_t +\delta\left(T_i\cdot Post_t\right)+u_{it}.
- \gamma allows the groups to have different initial levels.
- \tau captures their common change over time.
- \delta measures the additional change in the treatment group.
A causal interpretation requires parallel trends in untreated potential outcomes.
The coefficient \delta is the difference between the two groups’ changes. Treatment-group membership T_i is fixed, while exposure D_{it}=T_i\cdot Post_t changes when the intervention begins. We retain this distinction as we add periods.
Multiple Units and Multiple Periods
Suppose we observe the same units over several periods. For now, treated units share one treatment date and the control units remain untreated.
Y_{it}=\alpha_i+\lambda_t+\delta D_{it}+u_{it}, \qquad D_{it}=T_i\cdot Post_t.
- \alpha_i: a separate intercept for each unit.
- \lambda_t: a separate effect for each calendar period.
- \delta: the treatment coefficient.
This is a two-way fixed effects (TWFE) regression.
A unit might be a restaurant, a school, a local authority or a media market. A panel follows the same units over time. The two sets of fixed effects accommodate permanent differences between units and changes shared by all units in a given period. With a balanced two-period panel and a binary treatment group, the treatment coefficient reproduces the basic DiD. With more periods, the simple model imposes one treatment coefficient across the post-treatment periods. We will relax that restriction using an event study.
What Unit Fixed Effects Do
\alpha_i absorbs characteristics of unit i that are constant over the observation period, including unobserved characteristics.
Examples include:
- A location’s geography.
- A school’s persistent organisational characteristics.
- A media market’s persistent propensity to watch television.
The treatment effect is identified using changes within units, compared across units.
A variable that takes the same value for a unit in every period is perfectly explained by its unit indicators. Its separate coefficient cannot also be estimated. This is why the fixed treatment-group indicator T_i disappears into \alpha_i, while the time-varying exposure indicator D_{it} remains. Absorbing a permanent difference does not account for a characteristic whose influence changes over time. For example, a fixed local demographic composition may predict a changing fertility trend.
What Time Fixed Effects Do
\lambda_t absorbs a change common to every unit in period t.
Examples include a national recession or a nationwide change in measurement.
With one treatment date, Post_t is already explained by the period indicators.
Y_{it}=\alpha_i+\lambda_t+\delta D_{it}+u_{it}.
We still need a credible comparison for changes specific to the treatment group.
Period effects can take any pattern over time. They need not follow a straight line. A national recession can nevertheless affect regions differently, and those differential effects remain a possible confounder. Adding fixed effects therefore leaves the substantive parallel-trends argument essential.
Where Does the Identifying Variation Come From?
For a balanced panel, subtract the unit mean and period mean, then add back the overall mean:
\widetilde Y_{it}=Y_{it}-\bar Y_i-\bar Y_t+\bar Y, \qquad \widetilde D_{it}=D_{it}-\bar D_i-\bar D_t+\bar D.
The resulting regression is
\widetilde Y_{it}=\delta\widetilde D_{it}+\widetilde u_{it}.
OLS relates the remaining variation in outcomes to the remaining variation in treatment.
Here \bar Y_i is unit i’s mean over time, \bar Y_t is the mean across units in period t, and \bar Y is the overall mean. The same notation applies to D. Subtracting the unit mean removes \alpha_i. Subtracting the period mean removes \lambda_t. Adding the overall mean corrects for subtracting the overall level twice. For an unweighted balanced panel, this is equivalent to including unit and period indicators in OLS. For an unbalanced panel, use a fixed-effects estimator or indicators rather than applying this simple double-demeaning formula mechanically.
Parallel Trends with Several Periods
Let b be the last untreated period. For each period t, the identifying assumption is
\begin{aligned} E\left[Y^0_{it}-Y^0_{ib}\mid T_i=1\right] &=E\left[Y^0_{it}-Y^0_{ib}\mid T_i=0\right]. \end{aligned}
- Before treatment, outcomes can provide evidence about this assumption.
- After treatment, the treated group’s Y^0_{it} is unobserved.
- Different initial levels are compatible with parallel trends.
The superscript zero denotes the outcome without treatment. As in Week 8, the key comparison is a change. Evidence from pre-treatment periods informs our judgement about the counterfactual after treatment, but does not reveal that counterfactual. We also require an unaffected comparison group and no effects before the chosen treatment date. If behaviour changes upon announcement, that date may need to define the beginning of treatment.
Including Covariates
For time-varying covariates:
Y_{it}=\alpha_i+\lambda_t+\delta D_{it} +\sum_{j=1}^{J}\theta_j X_{jit}+u_{it}.
A baseline characteristic X_{ji} is absorbed by unit fixed effects. Its interaction with time can still matter:
\sum_{s\ne b}\sum_{j=1}^{J}\rho_{js} X_{ji}\cdot\mathbf{1}\left(t=s\right).
Choose covariates using the policy and causal argument. Variables affected by treatment require particular care.
This extends Week 8’s baseline-covariate interactions with the post indicator. With several periods, interactions can allow the relationship between a baseline characteristic and the outcome to differ by period. The symbol \mathbf{1}\left(t=s\right) is an indicator: it equals one in period s and zero otherwise. In the application, baseline demographic characteristics may be associated with different subsequent trends. Adjusting for an outcome of treatment, such as a behavioural response that transmits the policy effect, can change the estimand or introduce bias.
Uncertainty in a Panel
Outcomes for the same unit in adjacent periods are often correlated.
- Use standard errors that allow for this dependence.
- Cluster at a level appropriate to how treatment is assigned and disturbances are related.
- Repeated observations do not create new independently treated units.
For a policy assigned across provinces, province-level clustering is a natural starting point.
The effective amount of independent information depends on the design. Many observations within a small number of policy units do not remove the difficulties associated with few independent clusters. Heteroskedasticity-consistent standard errors alone allow unequal variances but do not accommodate arbitrary within-unit serial correlation. Bertrand, Duflo and Mullainathan (2004) examine the consequences for DiD inference.
Why Event Studies?
An event study asks:
- Were treatment and control groups moving similarly before treatment?
- Did outcomes change when treatment began?
- Did effects grow, fade or reverse over time?
- Is there evidence of anticipation?
We replace one post-treatment coefficient with a sequence of coefficients.
Event Time
Let G be the common treatment date for the treated group. Define
k=t-G.
| Event time | Meaning |
|---|---|
| k=-3 | Three periods before treatment |
| k=-1 | Period immediately before treatment |
| k=0 | First treatment period |
| k=2 | Two periods after treatment begins |
Control observations are indexed by the same calendar periods, while remaining untreated.
For example, if treatment begins in 2010, then 2009 has event time -1 and 2012 has event time 2. Later, when adoption is staggered, each treated unit will have its own first-treatment date G_i. For this week’s basic derivation, a common G keeps the treatment–control comparison explicit.
Calendar Time and Event Time
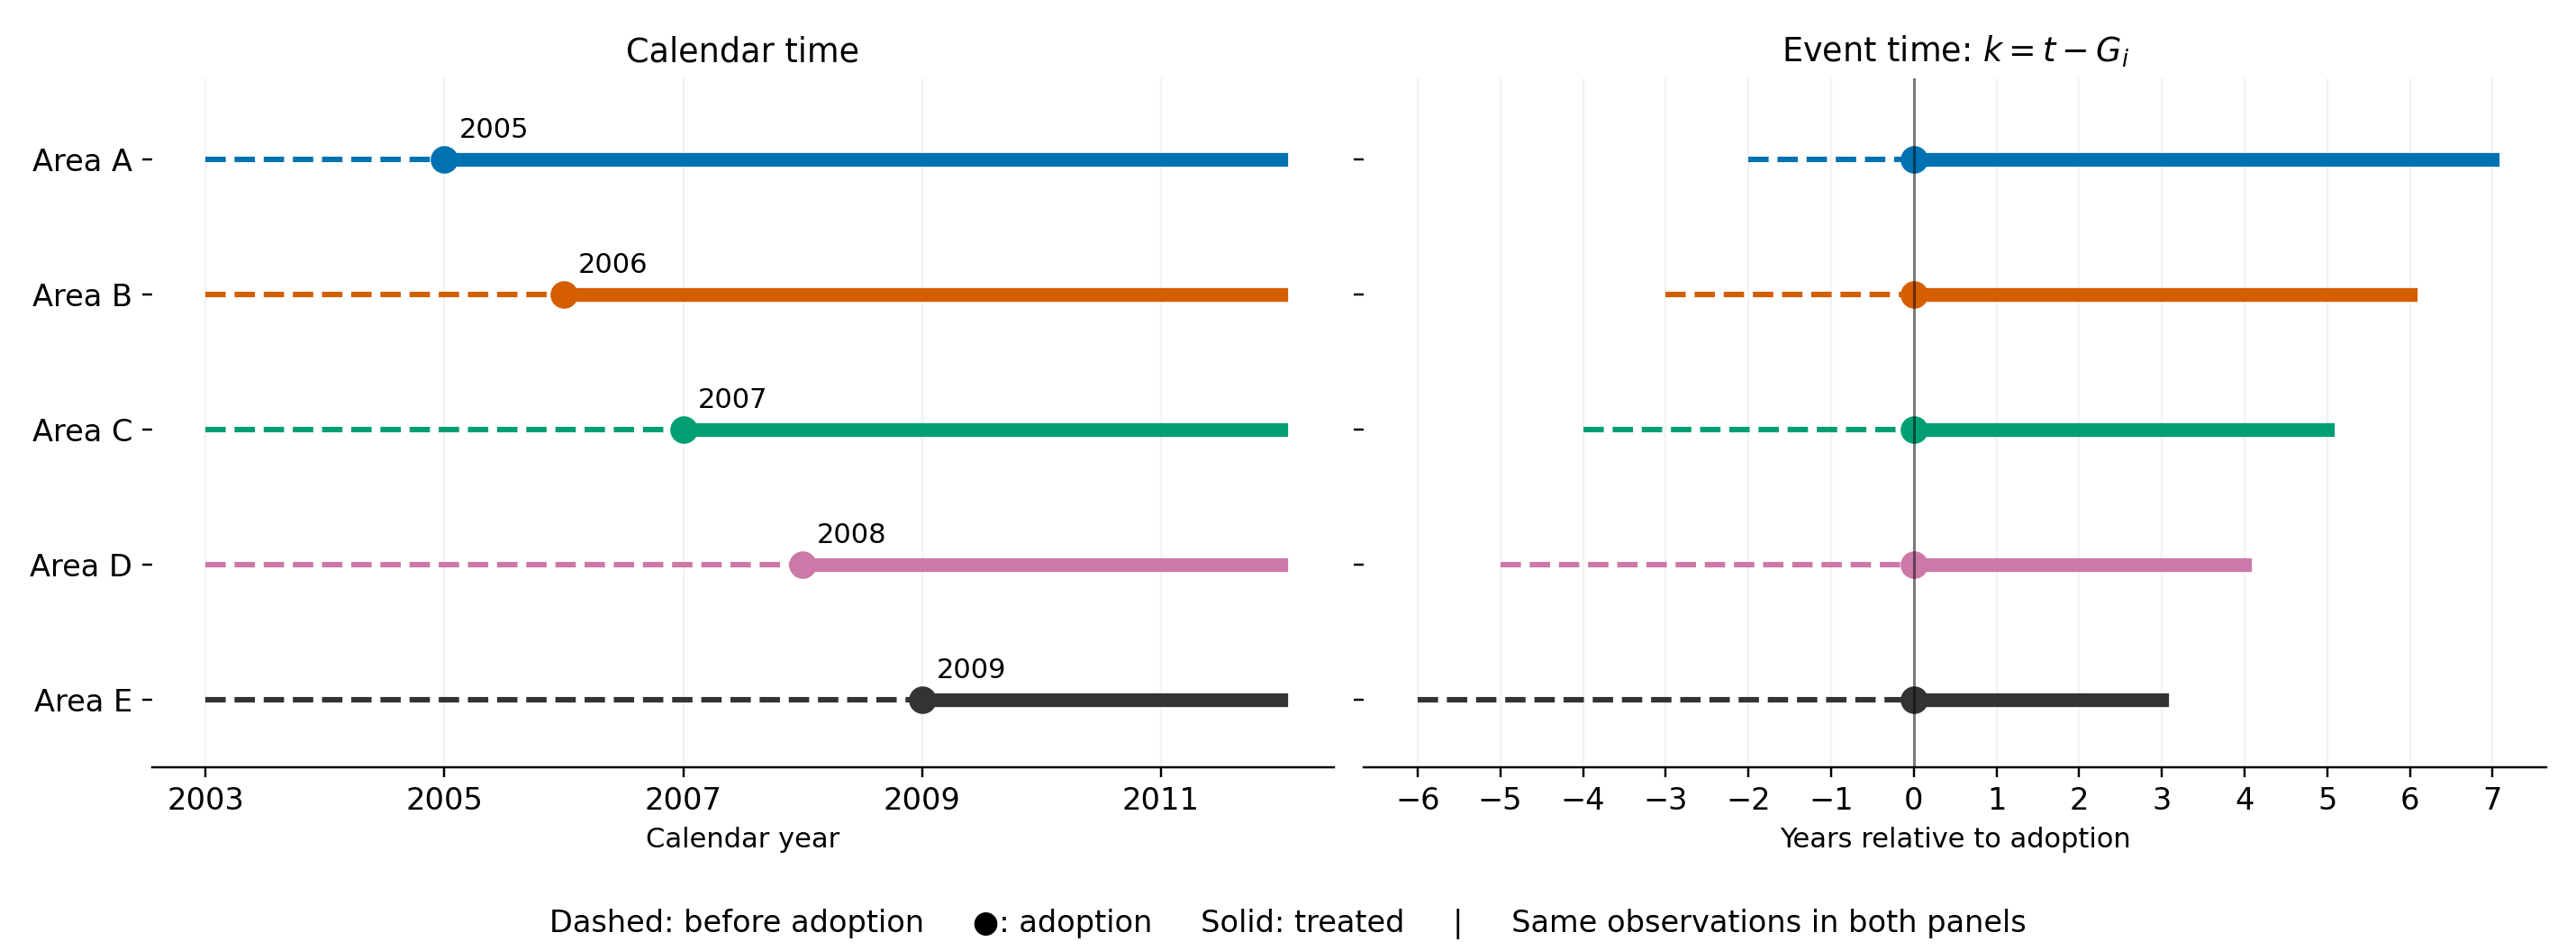
In calendar year 2008, Area A is at k=3 and Area E is at k=-1.
Calendar time t identifies when an observation occurred. Event time k=t-G_i measures how long before or after area i adopted. Area A adopts in 2005 and Area E in 2009. Their event-time-zero observations therefore occur in different calendar years. Each row shifts as a whole, preserving its observations and their order. Early adopters contribute more post-treatment years in this common calendar window. Calendar-year fixed effects still account for shocks in the actual year an observation occurred. Aligning the graph does not make observations from different calendar years occur simultaneously. The five areas are hypothetical.
From One Post Indicator to Period Indicators
For this introduction, the treated group adopts in the same year G.
Replace the single interaction T_i\cdot Post_t with a separate interaction for each period:
T_i\cdot\mathbf{1}\left(t-G=k\right).
- T_i=1 identifies membership in the treatment group.
- \mathbf{1}\left(t-G=k\right)=1 in the particular period k relative to adoption.
- Their product equals one for a treated-group observation in that period.
The symbol \mathbf{1}\left(\cdot\right) denotes an indicator: it equals one when the statement inside is true and zero otherwise. For example, T_i\cdot\mathbf{1}\left(t-G=2\right) selects treated-group observations exactly two years after adoption. Treatment remains on in later years, but a different period indicator selects those observations. All these interactions equal zero for control units. Calendar-period fixed effects apply to both groups. This is the treatment-group-by-period interaction approach used in Cunningham’s introductory event-study presentation.
What the Dummy Variables Look Like
One treated unit, adopting in G=2007 (T_i=1 throughout):
| Calendar year t | Event time k | T_i\cdot Post_t | T_i\cdot\mathbf{1}\left(t-G=0\right) | T_i\cdot\mathbf{1}\left(t-G=1\right) | T_i\cdot\mathbf{1}\left(t-G=2\right) |
|---|---|---|---|---|---|
| 2006 | -1 | 0 | 0 | 0 | 0 |
| 2007 | 0 | 1 | 1 | 0 | 0 |
| 2008 | 1 | 1 | 0 | 1 | 0 |
| 2009 | 2 | 1 | 0 | 0 | 1 |
Treatment stays on. Each period indicator selects one particular year.
The table shows the three post-treatment interactions in this short example. In 2010, treatment would still equal one and the interaction for k=3 would equal one. The displayed interactions for k=0,1,2 would all equal zero. We also construct interactions for pre-treatment periods, omitting k=-1 as the reference. Every interaction is zero for control observations because T_i=0. Before dropping the reference category, each treated observation belongs to exactly one event-time category. Dropping it leaves all included interactions at zero for treated observations in that reference period.
The Event-Study Regression
Y_{it}=\alpha_i+\lambda_t+ \sum_{\substack{k=-K\\k\ne-1}}^{L}\beta_k\left(T_i\cdot\mathbf{1}\left(t-G=k\right)\right)+u_{it}.
- \alpha_i: unit fixed effects.
- \lambda_t: calendar-period fixed effects.
- k=-1: the omitted reference period.
- \beta_k: the treatment–control gap in period k, relative to that gap at k=-1.
The event window runs from K periods before treatment to L periods after it begins. Without covariates, in a balanced panel with a common treatment date, each event-time coefficient is a two-period DiD using period -1 as its baseline. The \beta_k notation follows the original event-study graph. The single-coefficient TWFE model uses \delta, as in Week 8.
Why Omit a Period?
Across the full observation window,
\sum_{k=-K}^{L}T_i\cdot\mathbf{1}\left(t-G=k\right)=T_i.
T_i is already explained by the unit fixed effects. Including every event-time indicator creates perfect multicollinearity.
Set \beta_{-1}=0 by omitting that indicator.
The reference point is zero by construction. It has no estimated confidence interval.
The coefficients measure changes in the gap relative to the baseline. A plotted zero in the reference period provides no evidence about the credibility of the design. Choosing a different reference changes the reported coefficients, although the fitted values from the same fully specified model remain unchanged. Comparing graphs with different reference periods requires care.
A Coefficient Is a Difference-in-Differences
Write \bar Y_{1,k} and \bar Y_{0,k} for the treated and control means at event time k.
\widehat\beta_k= \left(\bar Y_{1,k}-\bar Y_{0,k}\right) -\left(\bar Y_{1,-1}-\bar Y_{0,-1}\right).
Under parallel trends and no anticipation, post-treatment coefficients estimate effects on the treated at each horizon.
Pre-treatment coefficients describe changes in the group gap before treatment.
This equality applies to the balanced, unadjusted common-date model. Covariate adjustment and weighting alter the comparison. A negative pre-treatment coefficient says that the group gap in that earlier period was smaller than its gap at the reference date. It does not, by itself, represent a causal effect of future treatment.
Reading an Event-Study Graph
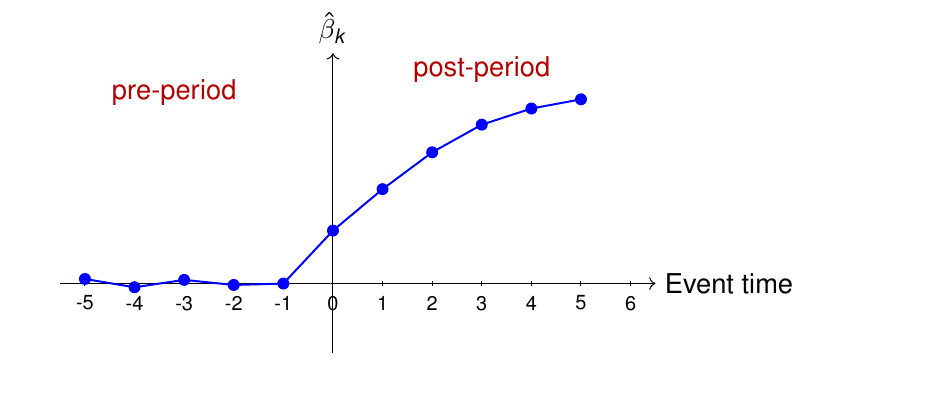
This schematic illustrates the coefficient pattern. Empirical graphs also need uncertainty intervals.
The original lecture graph shows estimated coefficients near zero before treatment and effects increasing after treatment. The horizontal axis is time relative to the intervention. The vertical axis has the units of the dependent variable. Notice the zero at k=-1, the first post-treatment point at k=0, and the evolving effect thereafter. The schematic has no confidence intervals, so it cannot tell us how precisely any of those points is estimated.
Leads and Lags
Leads: coefficients for pre-treatment event times, excluding the reference period.
Lags: coefficients for post-treatment periods, with k=0 marking treatment onset.
When reading an empirical graph, identify:
- The outcome and its units.
- The omitted period and treatment date.
- The estimates and confidence intervals.
- The periods and units contributing to each point.
What Do Pre-Treatment Coefficients Test?
A changing pre-treatment gap can reflect:
- Different underlying trends.
- Anticipation of treatment.
- Changes in sample composition.
- An inappropriate regression specification.
Sampling variation also matters. Examine both the pattern and its uncertainty.
A significant lead merits investigation. A collection of leads also creates multiple opportunities to find a statistically significant coefficient by chance. Conversely, wide confidence intervals can be compatible with economically important departures from parallel trends. Ask whether deviations large enough to change the policy conclusion are consistent with the evidence.
Joint Tests of Pre-Trends
A common null hypothesis is
H_0:\beta_{-K}=\cdots=\beta_{-2}=0.
- A joint test assesses the pre-treatment coefficients together.
- Rejection challenges the proposed comparison or treatment timing.
- Failure to reject can reflect low statistical power.
Combine the test with the graph and knowledge of the setting.
The test uses the covariance between the estimated coefficients. Counting individual significant coefficients is a different procedure. The test concerns the observed pre-treatment period, while the identifying assumption concerns the missing counterfactual after treatment. Extending the pre-period can reveal patterns that a shorter window conceals, although earlier observations may also describe a different economic environment.
Choosing the Time Window
A longer pre-period gives more evidence about the comparison.
A shorter window may describe more comparable circumstances.
Explain the choice using the setting, then investigate how the conclusion changes under plausible alternatives.
Selecting a window because its pre-trend test passes can distort subsequent inference.
This is a substantive choice that deserves explicit justification. The relevant question is whether the chosen historical period is informative about the untreated post-treatment path. Sensitivity analysis can ask how large a departure from parallel trends would overturn the conclusion. We leave the formal machinery for advanced reading. Roth (2022) explains the risks associated with conditioning an analysis on a pre-test.
Anticipation and Treatment Dynamics
Treatment may affect behaviour before its official implementation date.
- Announcement may induce early responses.
- Implementation may be gradual.
- Outcomes may respond with a delay.
For fertility, conception and birth occur at different dates. Match the event clock to the mechanism.
An apparent lead may be an effect if the intervention was known in advance. Conversely, an outcome measured after implementation may reflect decisions taken before it. Excluding a transition period can help in some settings, but changes the observations and horizons used in the comparison. Explain that choice explicitly. A single TWFE coefficient can conceal effects that grow or fade as exposure accumulates.
Binning Distant Periods
Researchers sometimes combine endpoint periods, for example
T_i\cdot\mathbf{1}\left(t-G\leq-5\right),\qquad T_i\cdot\mathbf{1}\left(t-G\geq5\right).
The final point then represents several periods.
Check what each point contains. With staggered adoption, distant horizons may also contain fewer cohorts.
Binning pools periods by restricting them to share a coefficient. It can improve precision at the cost of concealing changes within a bin. A label such as “5+” should be distinguished from an estimate for exactly five periods after treatment. With one common treatment date in a balanced panel, the same units can contribute throughout the window. Changing cohort composition becomes particularly important next week.
Healthcare and Fertility: The Policy
Cesur, Güneş, Tekin and Ulker (2023) study Turkey’s Family Medicine Program.
- Each citizen was assigned a family physician providing free primary care at neighbourhood clinics.
- Services included reproductive health and family planning.
- Adoption spread across provinces from 2005 to 2010.
For discussion: Why might this policy change fertility? Would you expect the response to be immediate or gradual?
Reducing fertility was not an explicit objective of the reform. Access to contraception, counselling and a continuing relationship with a physician could nevertheless affect childbearing. The response may differ by age and may take time as clinics become established. This makes the distinction between an average post-treatment effect and a sequence of effects substantively useful.
Healthcare and Fertility: Data and Identification
- Province-year data, 2001–2018, covering all 81 provinces.
- Outcomes: births per 1,000 women, separately by age group.
- Treatment: introduction of the Family Medicine Program.
- Compare changes across provinces adopting at different dates.
For discussion: What must be true of the timing of adoption for these comparisons to identify a causal effect? Which differences can province fixed effects absorb?
The published analysis combines administrative birth and population data with programme adoption dates. Its specifications include province fixed effects, region-by-year fixed effects, province-specific linear trends and time-varying controls. Regressions use population weights for the relevant age group and cluster standard errors by province. Adoption was not randomized. The identifying argument requires that, after these adjustments, untreated fertility paths would provide a credible comparison across adoption cohorts. Time-varying determinants of fertility associated with rollout remain a concern. All provinces eventually adopt, so comparisons at long horizons require particular care. We return to the choice of comparison groups in Week 10.
Cesur et al.: Figure 4, Teenagers
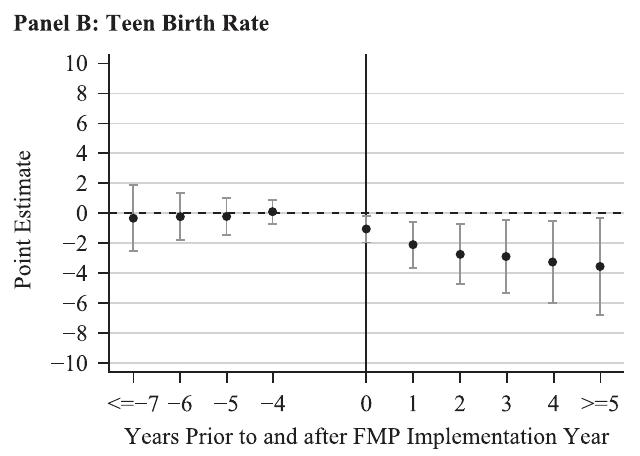
Figure 4, Panel B. Cesur et al. (2023). Births per 1,000 women aged 15–19. Bars: 95% confidence intervals.
For discussion: Interpret both axes, the pre-treatment estimates and the pattern after adoption. What do the confidence intervals tell us?
The published graph displays leads through k=-4 and post-treatment coefficients from k=0, with the endpoints grouped. Unlike our introductory model with a common treatment date and one omitted period, this specification also includes province-specific trends and omits additional pre-treatment periods. Footnote 21 discusses the normalization required when all units eventually adopt. The plotted pre-treatment intervals include zero, while the post-treatment estimates become more negative. Assess their precision as well as their sign. These are changes in births per 1,000 women, not percentage changes.
Cesur et al.: Figure 4, Ages 25–29
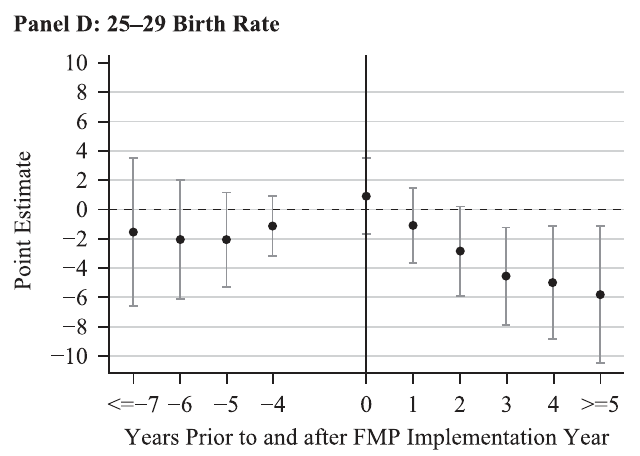
Figure 4, Panel D. Cesur et al. (2023). Births per 1,000 women aged 25–29. Bars: 95% confidence intervals.
For discussion: Compare the timing and precision with teenagers. What might a single post-treatment coefficient conceal?
Table 2 makes the distinction concrete. Its single post-treatment coefficient for women aged 25–29 is -0.145 (standard error 1.190). The dynamic specification instead reports progressively larger reductions several years after adoption. For teenagers, the single coefficient is -1.585 (standard error 0.531). These specifications summarize effects differently. Discuss whether the patterns support the proposed mechanisms and what additional evidence would distinguish them. An insignificant average coefficient can coexist with an evolving response.
16 and Pregnant: The Question
Kearney and Levine (2015) examine whether exposure to MTV’s 16 and Pregnant reduced teenage childbearing.
The programme began broadcasting nationally in 2009, while exposure differed across media markets.
For discussion: Explain the proposed mechanism. What comparison might distinguish the effect of the programme from the existing decline in teenage births?
This application asks whether media exposure changes behaviour. Its common broadcast date makes the choice of comparison especially important. Markets were not randomly assigned to high or low exposure. Distinguishing the effect of exposure from different underlying local trends is central to the debate.
Data and Identification
For discussion: Identify the outcome, geographic unit, time period and measure of exposure. Explain how earlier MTV ratings are used as an instrument. What assumptions are required for differences in ratings to identify the programme’s effect?
The analyses combine birth data with Nielsen ratings at the designated market area (DMA) level. The outcome in the reproduced JJK tables is 100 times the natural logarithm of the birth rate among women aged 15–19. Kearney and Levine instrument programme ratings with earlier MTV ratings. A relevant instrument predicts subsequent programme exposure. Exclusion requires that earlier ratings do not predict subsequent birth-rate changes through other channels after the specified adjustments. Permanent market differences can be absorbed by fixed effects, but differences in trends remain consequential.
Exposure and the Post Indicator
Let R_i measure programme exposure and Z_i measure earlier MTV ratings. A simplified representation is
Y_{it}=\alpha_i+\lambda_t+\delta\left(R_i\cdot Post_t\right) +\sum_j\theta_jX_{jit}+u_{it}.
The instrument for R_i\cdot Post_t is Z_i\cdot Post_t.
The comparison uses differences in exposure across markets, with a common broadcast date.
This equation displays the core comparison rather than every detail of the published specifications. The fixed component R_i is absorbed by market fixed effects. The interaction varies over time and across markets. The reduced form replaces programme exposure with earlier MTV ratings. A reduced-form event study interacts those earlier ratings with period indicators. The assumption is that markets with different earlier ratings would otherwise have followed comparable birth-rate trends, conditional on the included controls. This links our IV discussion directly to the DiD argument.
Jaeger, Joyce and Kaestner: Figure 1
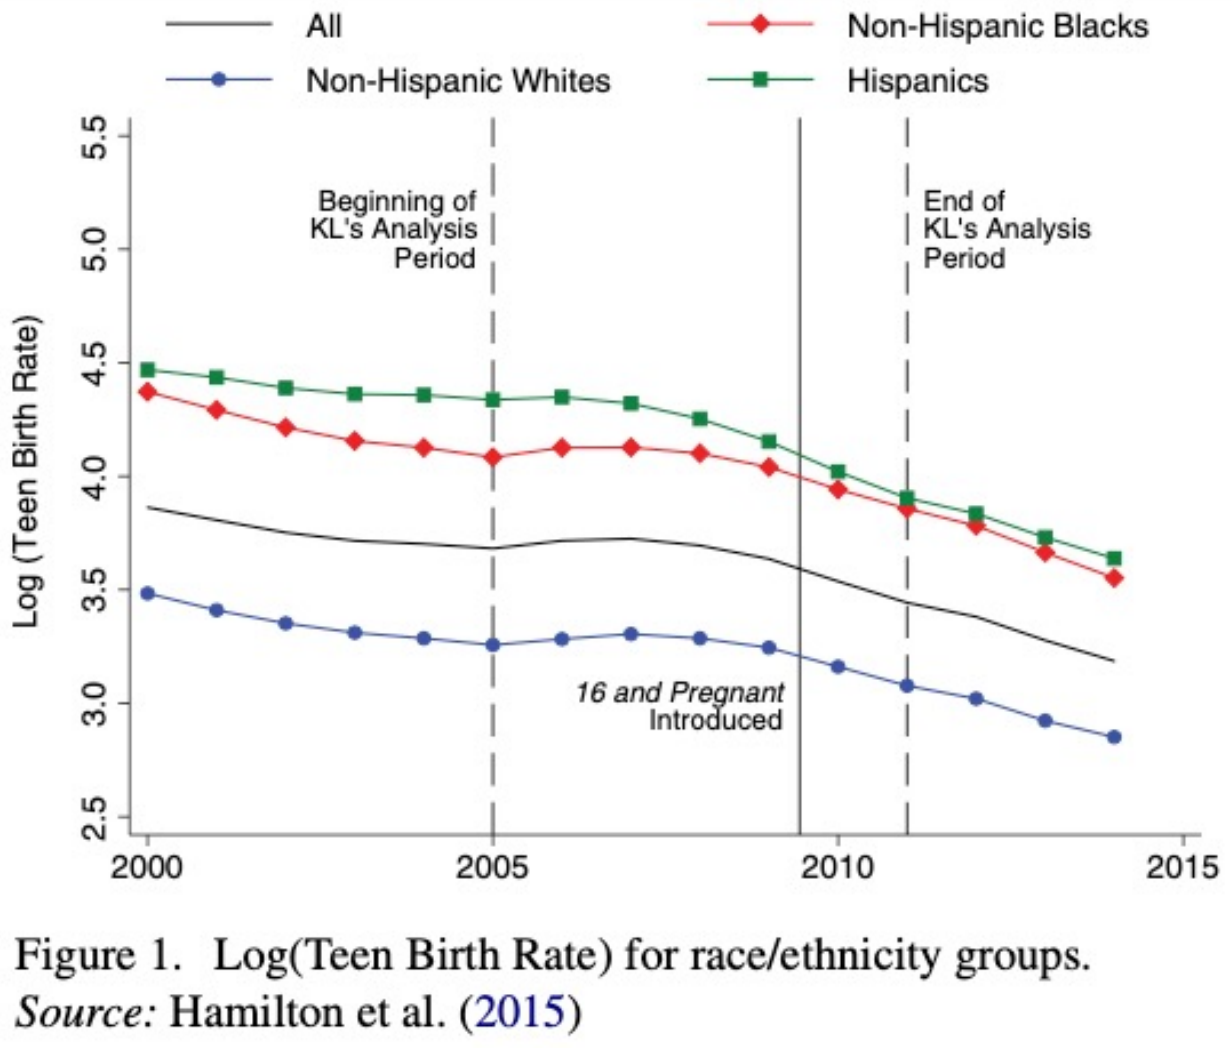
For discussion: Describe the trends before the programme. Why might differences in demographic composition matter for comparisons across media markets?
Jaeger, Joyce and Kaestner: Figure 2
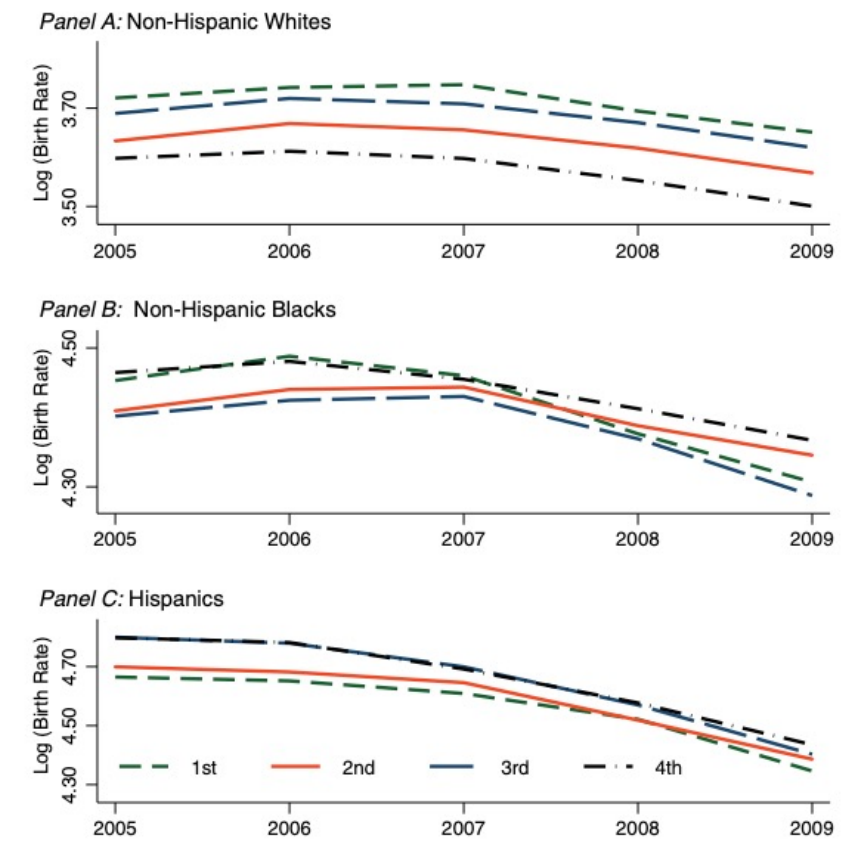
Figure 2. Log teen birth rates by MTV-rating quartile and race/ethnicity. Source: Jaeger, Joyce and Kaestner (2020). Panels retain their original scales.
For discussion: Compare the paths by MTV-rating quartile. What do these patterns suggest about the counterfactual comparison?
The figure examines birth-rate patterns before the programme’s introduction. Its panels distinguish racial and ethnic groups and compare markets classified by earlier MTV ratings. Discuss how much the direction of the patterns depends on which part of the pre-period is examined. Similar levels and similar trends are distinct properties.
Jaeger, Joyce and Kaestner: Table 1
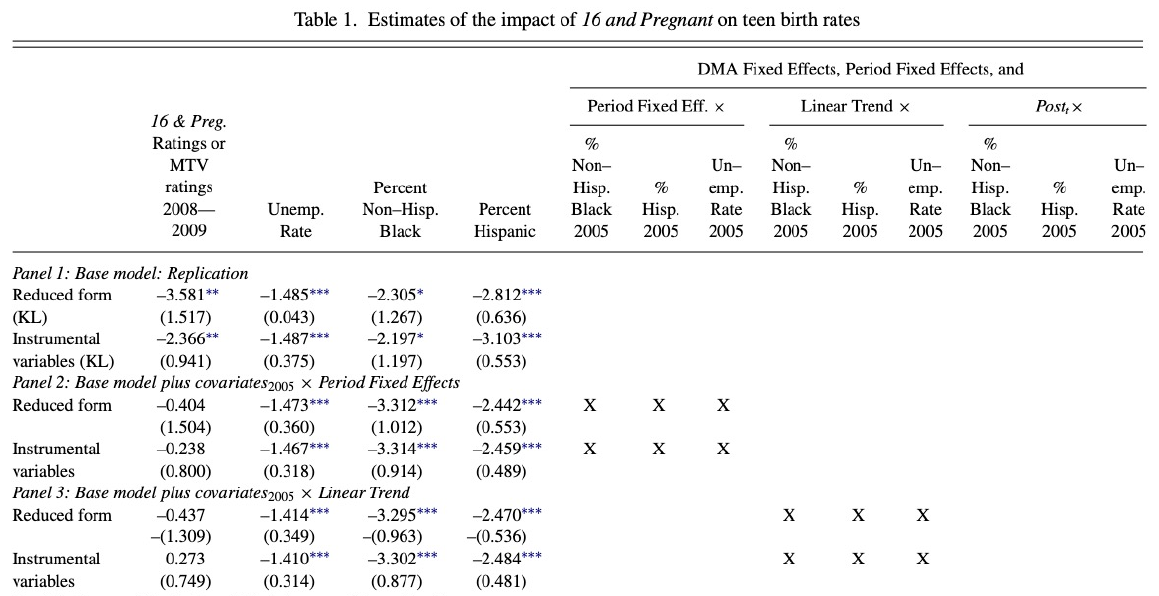
Table 1, Panels 1–3. Source: Jaeger, Joyce and Kaestner (2020). Outcome: 100 × log teen birth rate. Standard errors clustered by DMA. Population-weighted regressions.
For discussion: Compare Panels 1–3. What changes in the specification? Explain the magnitude and uncertainty of the reduced-form and IV estimates.
The exhibit shows Panels 1–3 of Table 1. Panel 1 reproduces the original reduced-form and IV estimates. Panel 2 allows baseline covariates to have period-specific relationships with the outcome. Panel 3 interacts them with a linear time trend. Relate these specifications to the covariate discussion above. Since the outcome is 100 times log birth rates, coefficients are approximately percentage changes for a one-unit change in the relevant ratings measure. They are not percentage-point changes in a birth probability. The table uses DMA-clustered standard errors and population weights. Compare the point estimates and standard errors, and discuss which specification has the strongest substantive justification.
Jaeger, Joyce and Kaestner: Figure 3
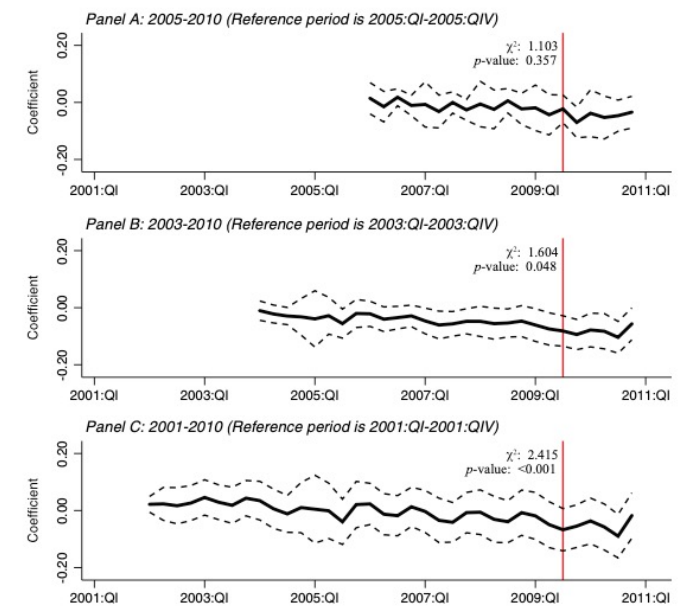
Figure 3. Reduced-form event studies with different pre-periods and reference years. Source: Jaeger, Joyce and Kaestner (2020). Dashed lines show 95% intervals.
For discussion: What changes as the pre-period expands? Check the reference periods, confidence intervals and joint tests. Does your assessment of the design change?
The panels begin in 2005, 2003 and 2001 respectively and use different reference years. The coefficients describe changes in the relationship between earlier MTV ratings and birth rates relative to each reference year. Accordingly, compare the patterns and their timing rather than treating the vertical levels as directly interchangeable across panels. The longer windows allow us to see whether the pattern attributed to the programme was already developing. The reproduced figure reports tests of the pre-programme coefficients jointly. Its reference category is a year, illustrating why one should always check how an actual paper normalizes its event study.
Jaeger, Joyce and Kaestner: Table 5
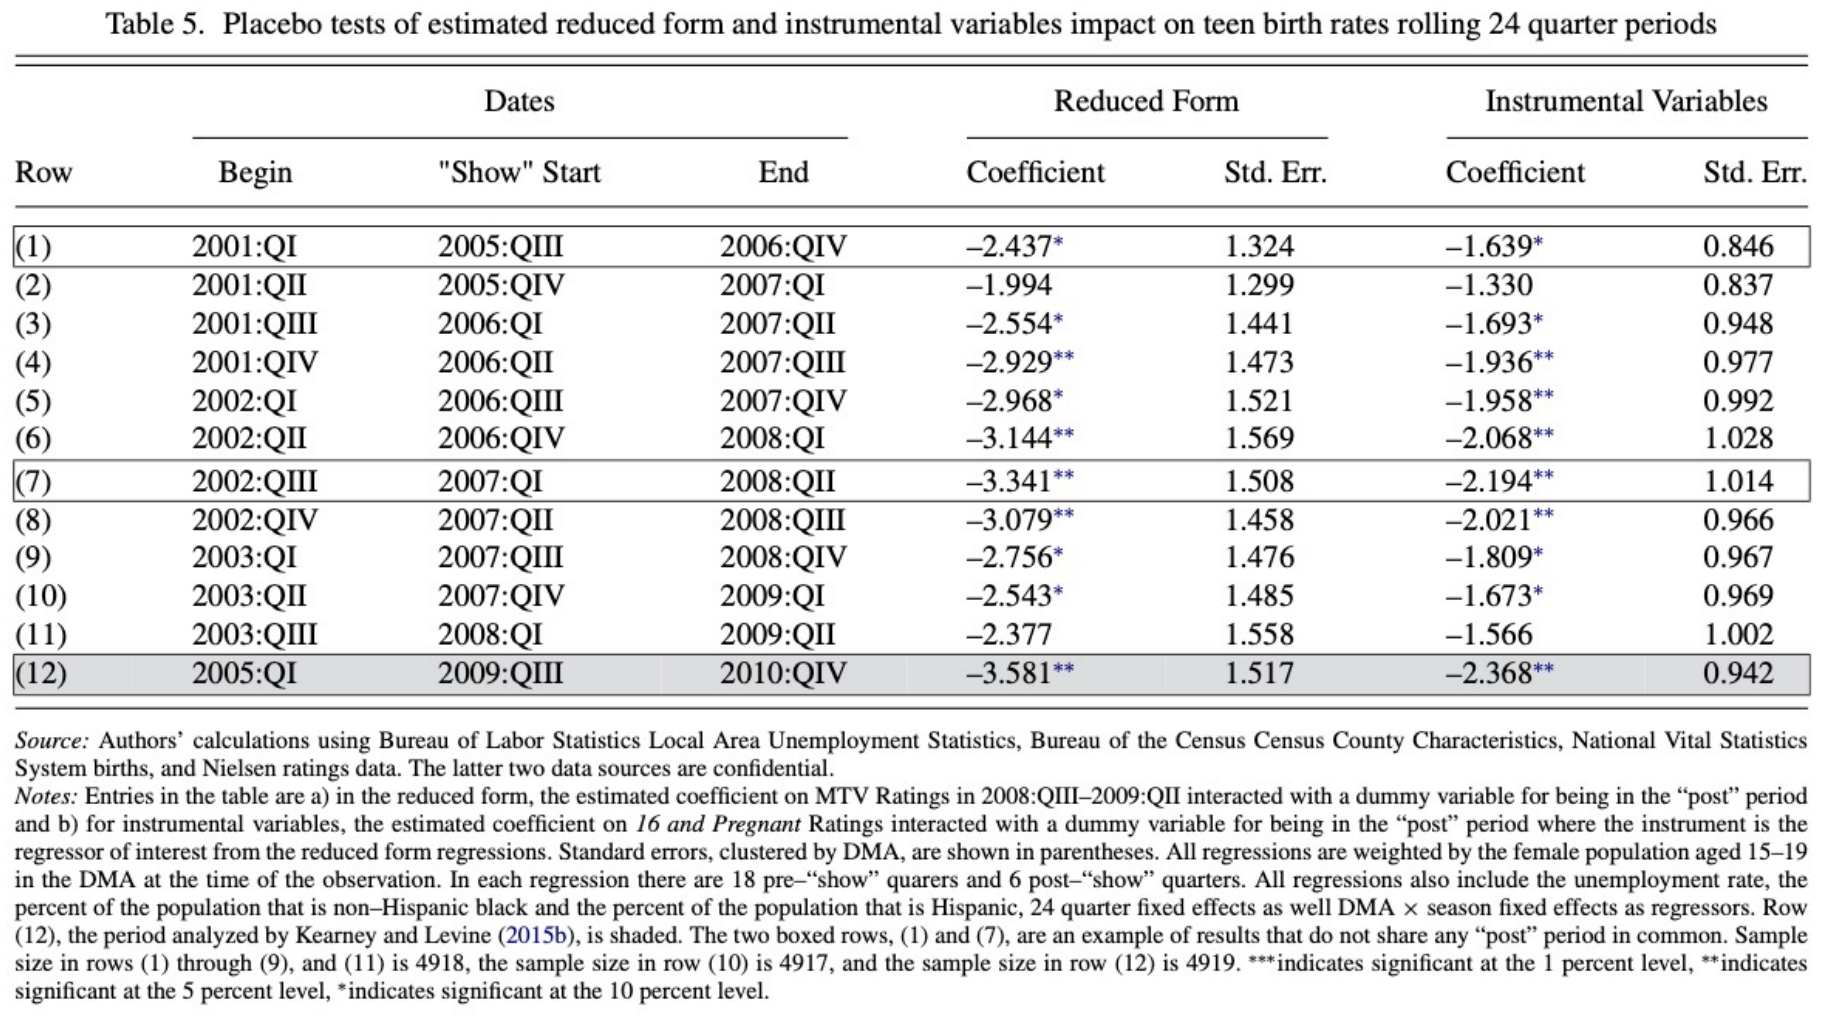
For discussion: Explain the placebo dates and samples. What would an apparent effect before the programme tell us about the identifying assumptions?
A placebo moves the putative intervention to a time when the programme had not yet begun. A systematic association at those dates would be consistent with the model attributing an existing differential trend to treatment. A placebo result is informative about the proposed comparison, but its interpretation still requires attention to the historical setting and specification. Relate this table to Figure 3 and the changes in controls in Table 1.
Assessing the Evidence
For discussion: Which evidence most affects your judgement? What would you tell a policymaker considering a media campaign to reduce teenage childbearing?
Distinguish the empirical finding, its identifying assumptions and the policy recommendation.
The original study and the critique disagree about the credibility of the comparison. Kearney and Levine’s subsequent response defends the original sample window and argues that a placebo association in an earlier period does not by itself overturn the change at programme introduction. Assess that argument against the full set of graphical and specification evidence. A useful evaluation explains why particular comparisons deserve more weight, and identifies what further evidence would change the conclusion.
Different Treatment Dates
For staggered adoption, first-treatment dates differ:
k=t-G_i.
A province three years after adoption may be compared with a province that has already been treated for five years.
If effects change with exposure duration, that comparison needs particular care.
Next week: identify the comparisons conventional TWFE makes, and how modern DiD methods change them.
The healthcare application raises both a substantive question about rollout and an estimation question about comparisons among cohorts. By contrast, the common broadcast date in the media application means that staggered-adoption contamination is not the central objection. A different estimator cannot supply a credible counterfactual when the substantive identifying assumption fails. We will focus next week on the logic of appropriate comparisons rather than a catalogue of estimators.
Reading an Event Study: Checklist
- What is the treatment, comparison and treatment date?
- What is the outcome, in what units?
- Which period is omitted?
- Are pre-treatment estimates informative in both magnitude and precision?
- Is anticipation or a delayed response plausible?
- Are endpoints binned or samples changing across horizons?
- What uncertainty does the design allow us to quantify?
Python: Estimating the Models
The following code illustrates the common-date model for a balanced panel data. Each row is a unit-period observation. unit identifies the unit, year is calendar time, treated is fixed at one for the treated group and zero for controls, and outcome is the dependent variable. Suppose the observations run from 2007 to 2013 and treatment begins in 2010. Adapt the dates and names to the dataset you are analysing.
Now construct event-time indicators. The 2009 interaction is omitted, making event time -1 the reference period. Every event indicator remains zero for control units.
data["event_m3"] = data["treated"] * (data["year"] == 2007)
data["event_m2"] = data["treated"] * (data["year"] == 2008)
data["event_0"] = data["treated"] * (data["year"] == 2010)
data["event_p1"] = data["treated"] * (data["year"] == 2011)
data["event_p2"] = data["treated"] * (data["year"] == 2012)
data["event_p3"] = data["treated"] * (data["year"] == 2013)

event_study = smf.ols(
    "outcome ~ event_m3 + event_m2 + event_0 + event_p1"
    " + event_p2 + event_p3 + C(unit) + C(year)",
    data=data
).fit(cov_type="cluster", cov_kwds={"groups": data["unit"]})
print(event_study.summary())

# Test the two pre-treatment coefficients jointly.
print(event_study.wald_test("event_m3 = 0, event_m2 = 0", scalar=True))
The formula strings on adjacent lines are joined by Python. The model includes both fixed effects and the event-time interactions. The treatment indicator is excluded from this second specification because it is the sum of the post-treatment event indicators.
Use a complete estimation sample for the model’s variables so that the cluster identifiers line up with the regression observations. For example, if these are the only variables used, start with data = data.dropna(subset=["outcome", "unit", "year", "treated"]).copy().
A coefficient table and graph
import pandas as pd
import matplotlib.pyplot as plt

names = ["event_m3", "event_m2", "event_0", "event_p1", "event_p2", "event_p3"]
intervals = event_study.conf_int().loc[names]
results = pd.DataFrame({
    "event_time": [-3, -2, 0, 1, 2, 3],
    "estimate": event_study.params.loc[names].to_numpy(),
    "lower": intervals[0].to_numpy(),
    "upper": intervals[1].to_numpy()
})
print(results.round(4))

fig, ax = plt.subplots(figsize=(8, 4))
ax.errorbar(
    results["event_time"], results["estimate"],
    yerr=[results["estimate"] - results["lower"],
          results["upper"] - results["estimate"]],
    fmt="o", color="black", capsize=4, label="Estimate and 95% interval"
)
ax.scatter(-1, 0, marker="s", facecolors="none", edgecolors="black",
           label="Omitted reference period")
ax.axhline(0, color="grey", linewidth=1)
ax.axvline(-0.5, color="black", linestyle="--", linewidth=1)
ax.set(xlabel="Periods relative to treatment", ylabel="Effect on outcome")
ax.legend()
fig.tight_layout()
fig
The open square marks the normalization. Its lack of an interval reflects the fact that no coefficient is estimated for that period. The intervals for the other points are pointwise intervals, while the joint pre-trend test addresses the pre-treatment coefficients together.
References
Kearney, M. S., and P. B. Levine (2015). Media Influences on Social Outcomes: The Impact of MTV’s 16 and Pregnant on Teen Childbearing. AER 105(12): 3597–3632.
Jaeger, D. A., T. J. Joyce, and R. Kaestner (2020). A Cautionary Tale of Evaluating Identifying Assumptions: Did Reality TV Really Cause a Decline in Teenage Childbearing?. JBES 38(2): 317–326.
Cesur, R., P. M. Güneş, E. Tekin, and A. Ulker (2023). Socialized Healthcare and Women’s Fertility Decisions. JHR 58(3): 1028–1055.
Miller, D. L. (2023). An Introductory Guide to Event Study Models. JEP 37(2): 203–230.
Bertrand, M., E. Duflo, and S. Mullainathan (2004). How Much Should We Trust Differences-in-Differences Estimates?. Quarterly Journal of Economics 119(1): 249–275.
Roth, J. (2022). Pretest with Caution: Event-Study Estimates after Testing for Parallel Trends. American Economic Review: Insights 4(3): 305–322.
Kearney, M. S., and P. B. Levine (2016). Does Reality TV Induce Real Effects? A Response to Jaeger, Joyce, and Kaestner. IZA Discussion Paper 10318.